Pretty easy, looks great and easy to implement that was my first assumption when I was looking at web dashboard. These are pretty simple lines, rectangles, little circles and nothing else. But it was more than that. Making one chart is not a big deal but making chart this way that it can be used again and again in different places is one. There are simply two ways for creating and utilizing charts for web design. The first one is using smart objects while creating charts and all it took is photoshop to do that. You can simply use shapes to create charts and when it is done combine them and convert merged shape into smart object. Second way is using prebuilt resources & vectors in illustrator. Let’s overview them one by one.
1- Using smart objects – still remember the things when learning the tricks and tips in photoshop and the best one was use of smart objects. At that time converting something into smart object is somewhat equal to vector object in photoshop. That an original image/object will not lose its pixel quality when scaled down or up and the second point was you can use the same smart object again and again at many places and you want to change in one?? Double tap on smart object and it will open up in a new window for edit, do the change and save and it will reflect in all places. And most of us forgot the second point as we didn’t used it too much. And here is the simple process of using it. Simply open a new document in photoshop, use shapes to create a simple graph showing some stats like the screen below.
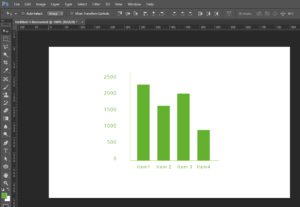
If you look at the layer panel you will be finding different layers of text and shapes like the below screen.
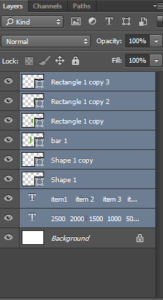
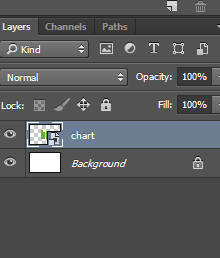
Simply select all the layers and right click and choose the option convert to smart object and that is it. All layers will merge into one and will create a smart object. you can double tap on it anytime to edit it. Now you are free to scale it up and down make its copy and place it any where in the document. Want a change? Double tap, change it once and changes will be reflected all over the place.
2- Using Vectors – The internet unlimited treasure of resources, information and inspiration. You can use it, browse what you are looking for and use the free resources. If you are find yourself wealthy enough to get the premium vectors you can use them too as per your needs. Illustrator that is used for to generate vector graphics, illustrations. If you don’t know yet that you can use illustrator assets in photoshop just by dragging them from illustrator program to photoshop than you should know it. Vectors and artwork generated in illustrator can be used in photoshop and they give you advantage of vector graphic as well as you can change them anytime once and the changes will be reflected all the time. Sites like freepik and vexels is a great place to get free and premium vectors.
You will get the downloaded vector file in .eps or .ai format, open it up in illustrator. select the necessary portion you want to select and drag it to the photoshop document to use there is also another option where you can select the object, right click on it and export it to be used as image but that is not what we are looking for. After dragging the object in photoshop you will the object in you PSD, look at the layer it says vector smart object.
Below is the first screen of Illustrator that shows line chart.
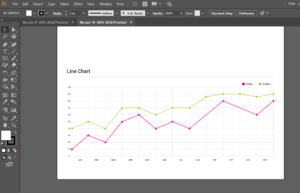
select the object
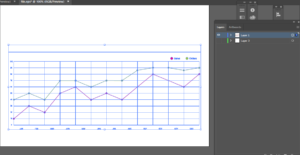
Drag it on the photoshop and the it will look like this.
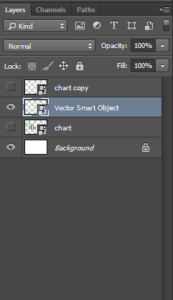
That is it for now. the same functionality goes for vector smart object you double click on it and it will open it in illustrator program, edit it and save and changes done in photoshop document as well.
Let me know how you are using photoshop to display graphs/charts in comment section.

